Longitudinal Trend Monitoring of Multiple Sclerosis Ambulation Using Smartphones
Our paper was recently accepted for publication in IEEE OJEMB! 🥳 Here I will summarise our main findings and the impact of our work.


Note: This article is best viewed in ‘light mode’! ![]()
Summary
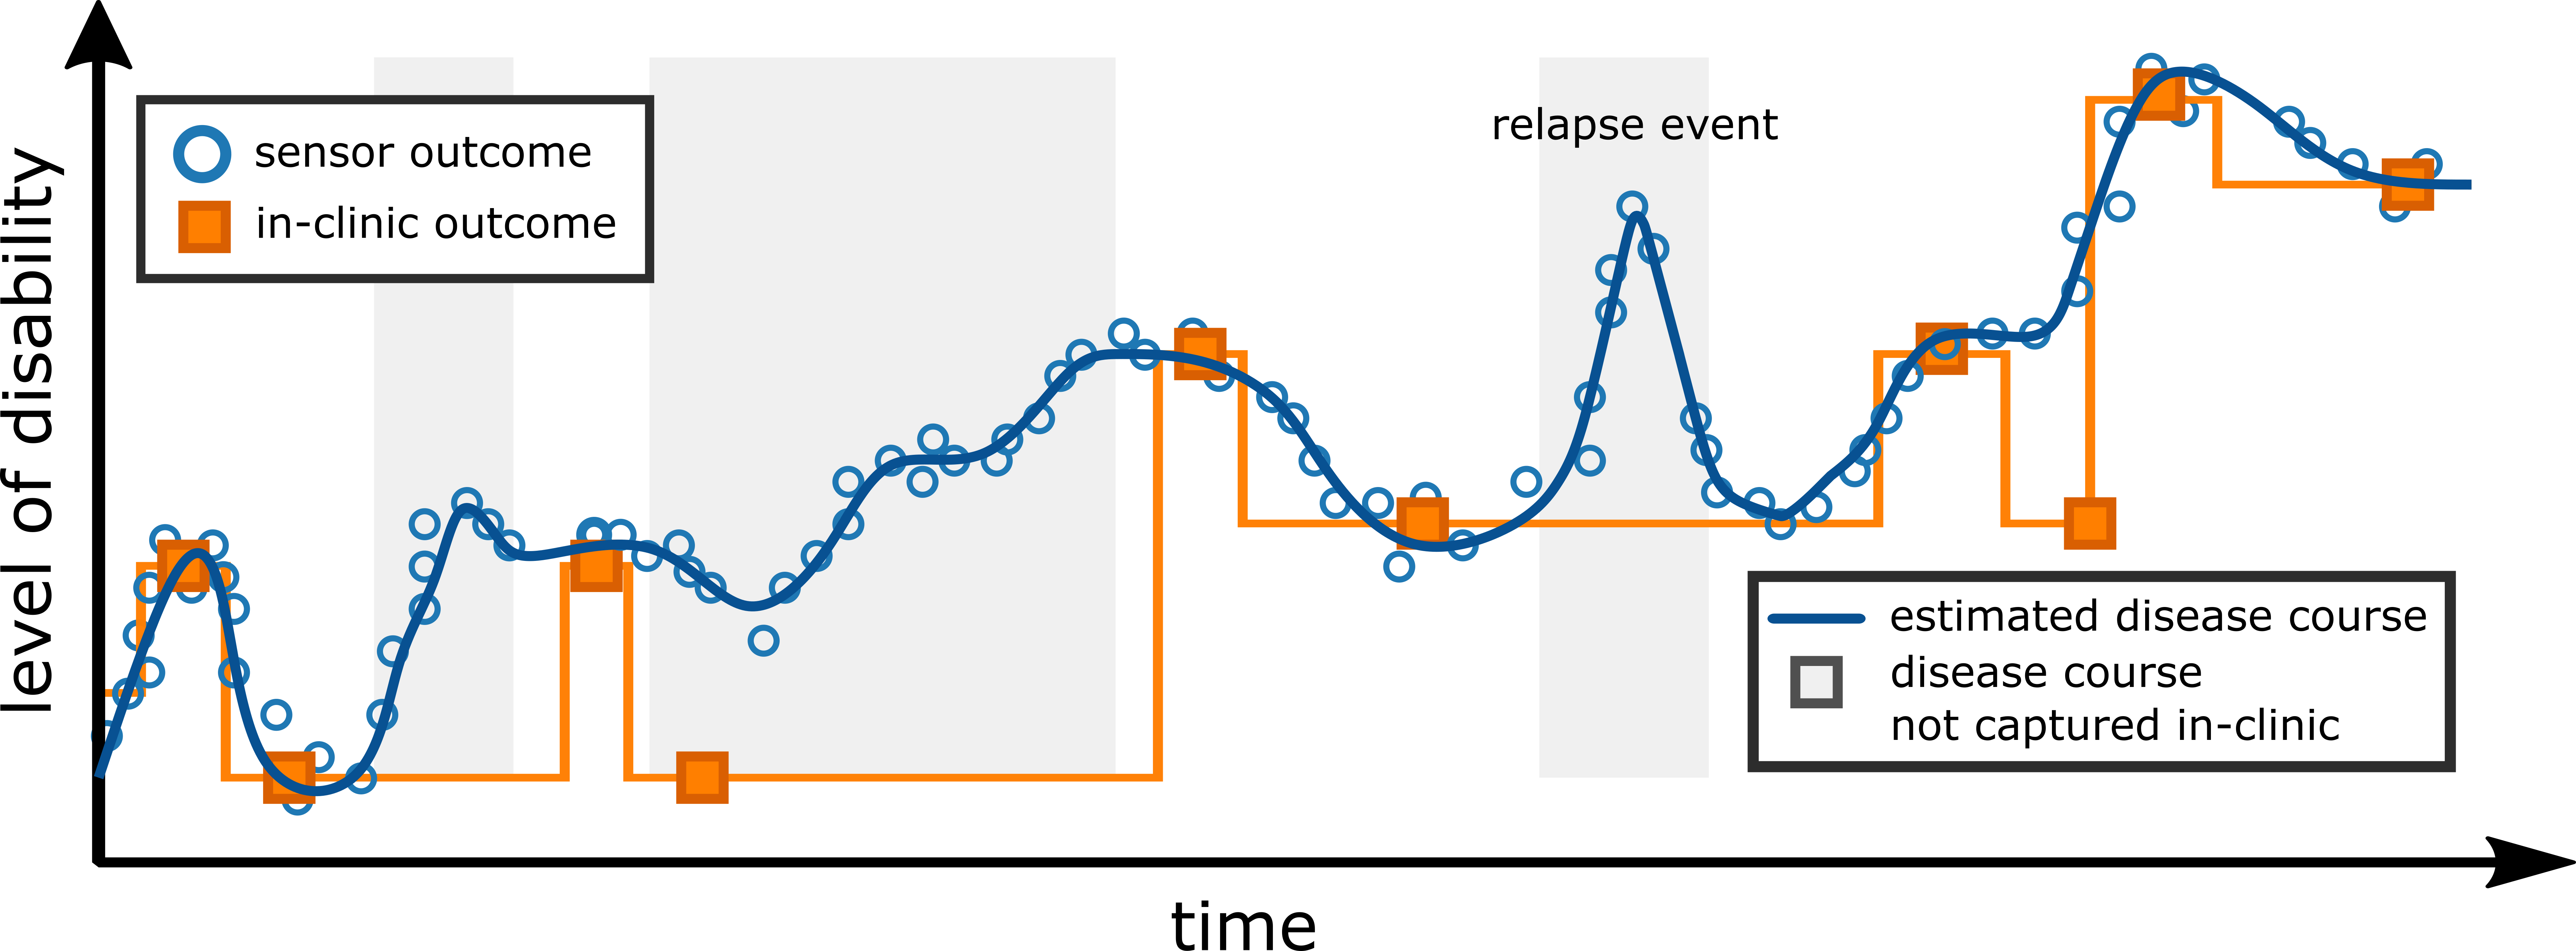
In recent years, the emergence of consumer digital technologies such as smartphones which are used for healthcare applications, has opened the possibility of developing rich, continuous, and objective measures of disease that can be administered remotely outside of standard clinical settings. For instance, consumer smartphone devices can objectively characterise ambulation and fatigue in people with multiple sclerosis (PwMS) which is one of the main symptoms of disease. Importantly, it has been shown that earlier identification of changes in PwMS impairment are important to identify and provide better therapeutic strategies.
In this work, we demonstrated how PwMS’ ambulatory patterns can be captured from smartphone inertial sensor-based measurements recorded during a daily “two-minute walk test” (2MWT), a remotely administered walking test as part of Roche’s seminal FLOODLIGHT study in MS. Deep networks offer state-of-the-art and data-driven approaches that are capable of learning smartphone sensor-based features capturing ambulatory information. Our study subsequently explored how deep convolutional neural networks (DCNNs) could be used to distinguish healthy controls (HC) from PwMS that have mild and moderate disability, longitudinally, over the 24-week study.
Our results indicated that smartphone-based ambulatory severity outcomes could accurately estimate MS level of disability, as measured by the clinician-administered EDSS score. Furthermore, longitudinal severity outcomes were shown to accurately reflect individual participants’ level of disability over the study duration. Anecdotally, we even observed the possibility of these measurements to remotely capture MS relapse events, where an increase in model-estimated symptom severity coincided with when two participants had self-reported that a relpase had occured using their smartphone application.
Background
The symptoms of neurodegenerative diseases, such as multiple sclerosis (MS), frequently fluctuate over time, and between patients, ensuring
that it is notoriously difficult to quantify effective therapeutic interventions and disease management techniques. Current in-clinic
assessments are often too infrequent to track changes in MS impairment over time. People with MS (PwMS) experience a progressive decline in physical function and quality of life and over time—this often leads to disability and difficulty to perform many tasks of daily life (think about going shopping, getting dressed, taking your dog on a walk, or caring for your children or grandchildren). Currently, the gold-standard methods of measuring the impact of MS on daily life rely on infrequent clinical visits that may often occur every 3–4 months, with assessments depending on a combination of subjective clinician-determined scores—in MS, clinicans use the Expanded Disability Status Scale (EDSS)
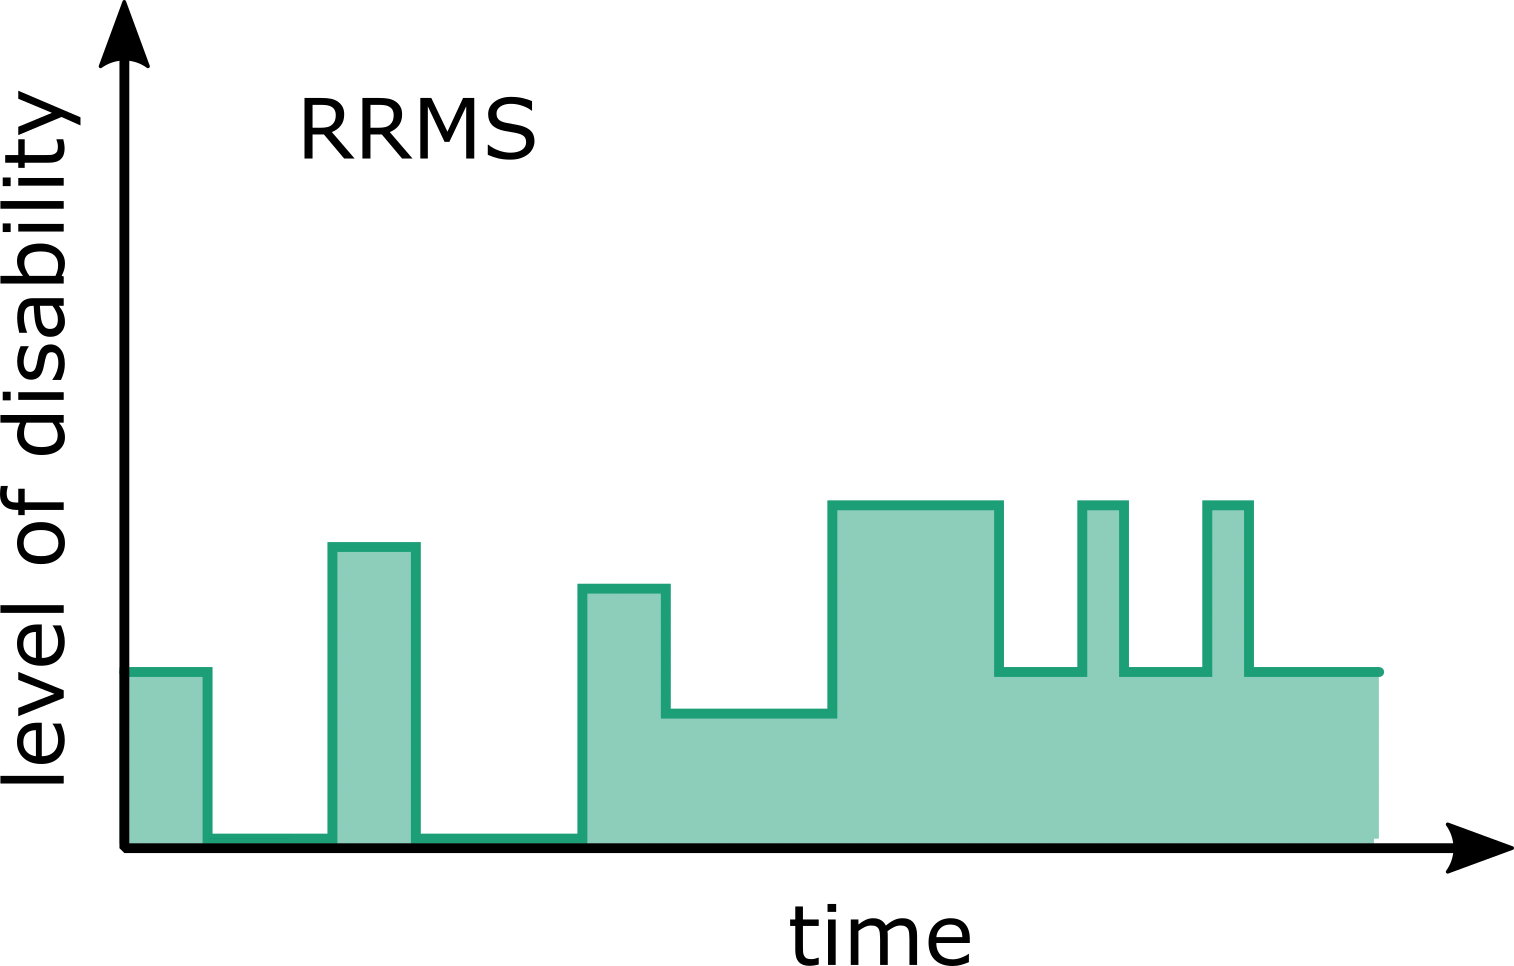
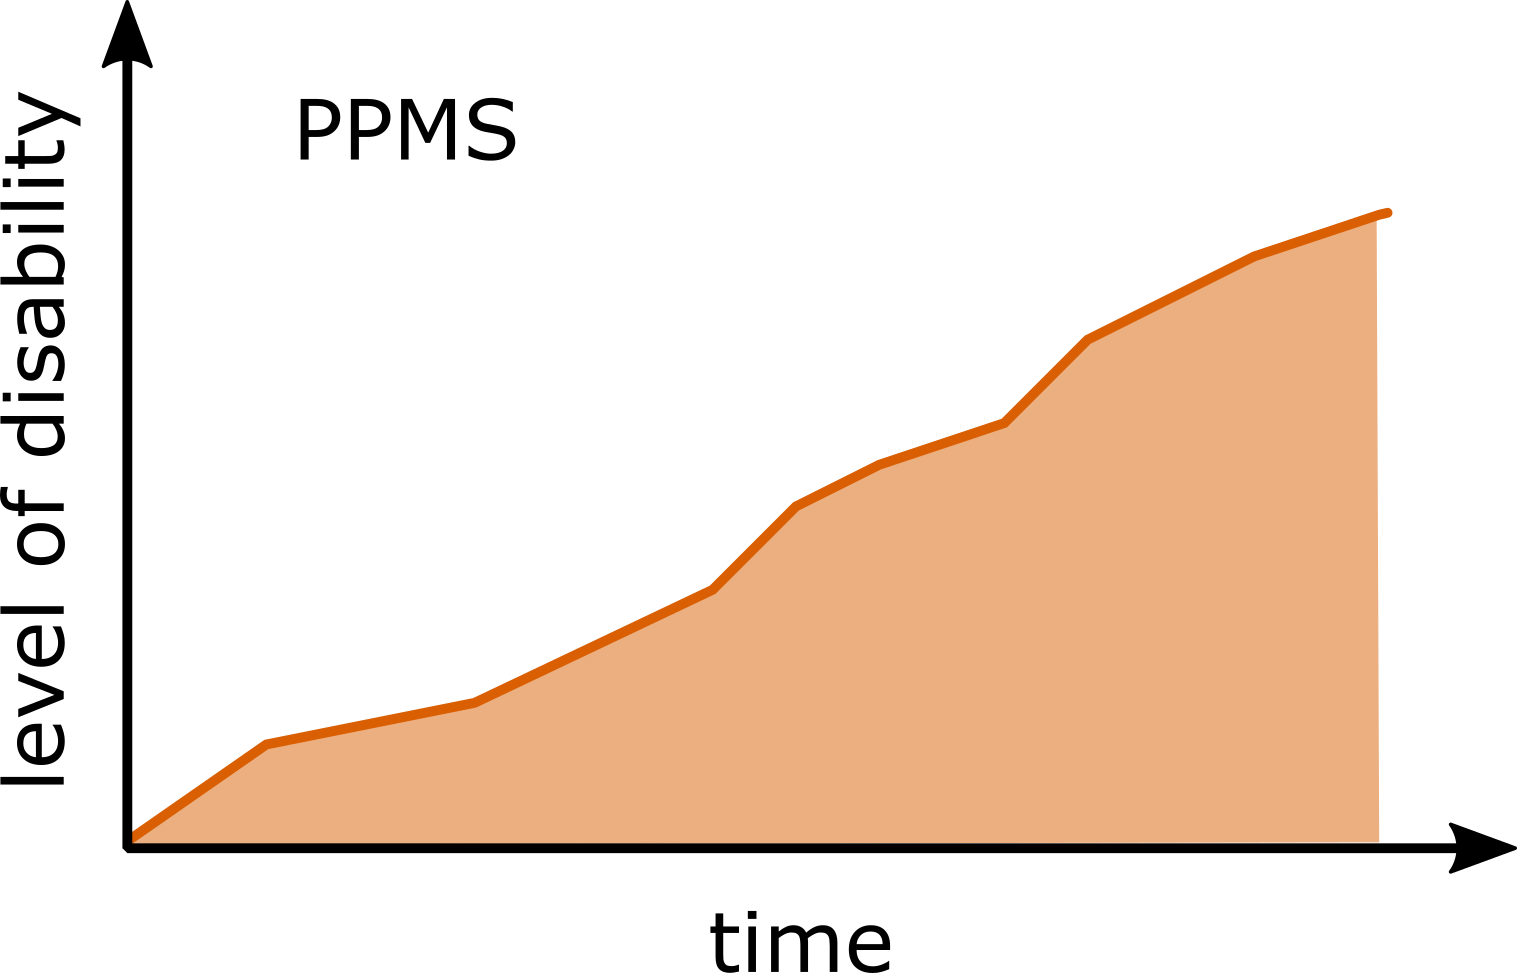
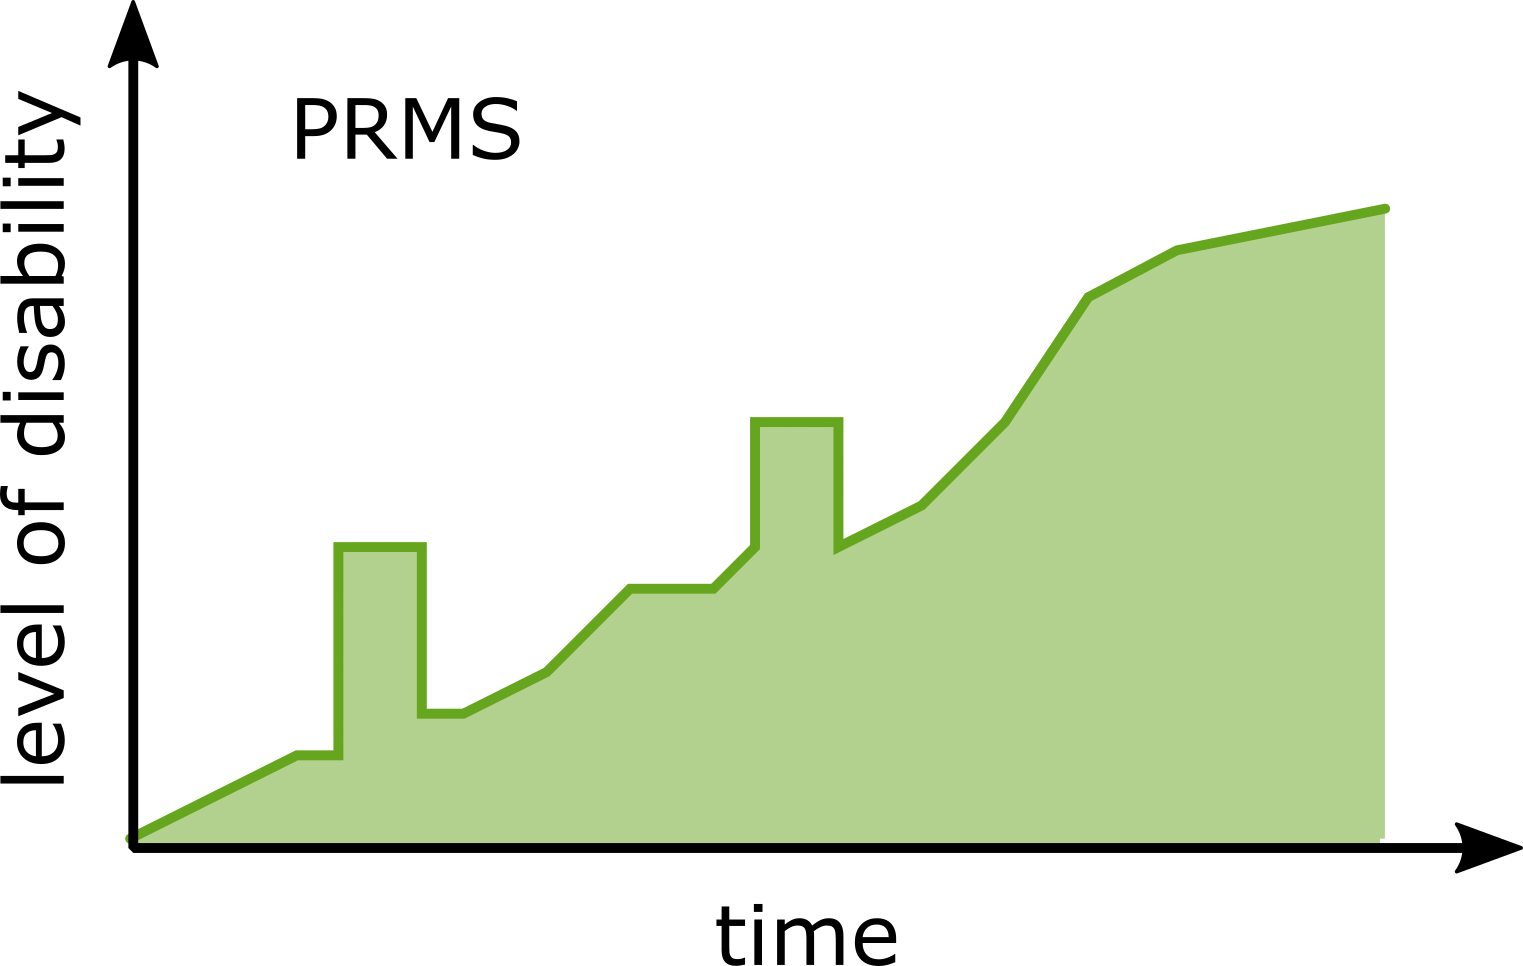
Although MS follows a highly heterogeneous and subject-specific disease course, the disease profiles have been grouped into four clinical phenotypes which are based on disease progression
- Relapsing-remitting MS (RRMS): the majority of PwMS will initially experience RRMS, a state dominated by sudden acute symptoms developing (a “relapse”) over days before generally plateauing over weeks or months termed “remission”. RRMS generally affects 85% of PwMS and disease activity typically occurs acutely at a sub-clinical level.
- Primary-progressive MS (PPMS): those experiencing consistent but worsening symptoms can be thought of as having PPMS (roughly 10% of PwMS).
- Secondary-progressive MS (SPMS): can occur in some RRMS patients, where the disease course continues to worsen with or without periods of remission. Half (50%) of RRMS patients will go onto develop SPMS.
- Progressive-relapsing MS (PRMS): is more rare (affecting fewer than 5% of PwMS); it occurs from diagnoses as a progressive disease course, with periods of relapse, but without any remission periods.
In recent years, there has been a shift towards the a adoption of body worn sensors to objectively evaluate ambulatory performance in PwMS, circumventing the need for resource-intensive and expensive gait laboratory equipment, but also opening up the possibility to measure physical function outside of standard clinical settings. These technologies can provide new data-driven metrics for clinical decision-making during in-clinic visits
Study Objectives
This study builds upon our previous investigations
Dataset
The FLOODLIGHT (FL) proof-of-concept (PoC) app was trialled in a 24-week, prospective study in PwMS and HCs (NCT02952911) to assess the feasibility of remote patient monitoring using smartphone (and smartwatch) devices
Methods
Estimating Ambulatory-related Disease Severity
The foundation of this work employs a Deep Convolutional Neural Network (DCNN) to estimate participants MS severity from the smartphone inertial sensor data was recorded while participants performed a daily, at home, two minute walk test (2MWT). The raw accelerometer sensor data from each 2MWT were then partitioned into multiple vector sequences (epochs), where a DCNN was then trained to classify a given epoch as having been performed by a HC, PwMSmild or PwMSmod participant. The DCNN model implemented has previously been introduced in Creagh et al. (2021)
The network outputs are interpreted as \(\hat y_k(\mathbf{x}_n,\mathbf{w}) = p(y_{k} = k|\mathbf{x}_n)\). As such, $\hat y_k$ can be thought of as the probability that a given epoch \(\mathbf{x}_n\) belonged to class $k$. A continuous estimate of severity (i.e., the predicted level of MS disability) can then be captured by taking an average of all epoch predictions over a test for a given assessment day, $d$ such that: \(\begin{align} \hat{y}_d= \frac{1}{N}\sum_{n=1}^{N} \underset{k}{\mathrm{argmin}} (p(\hat{y}_k=k | \mathbf{x}_n)) \end{align}\) where $N$ are the number of windowed epochs for a given test date, $d$, and $k$ lies in an ordinal range of $[0, 1,…K]$. Therefore $\hat{y}_d$ will be continuous such that $0\leq \hat{y}_d \leq K$ and can conceptualised as a naive estimate of MS disease severity, mapping a predicted level of disability ranging from healthy to mild to moderate.
Longitudinal Trend Monitoring
Longitudinal trends of specific participants were examined as a time-series by considering the severity estimates $\hat{y}$ of repeated 2MWTs over all their available data for the duration of the FL study. The goal of this work was to perform longitudinal analysis of participants severity and visualise the average severity trends over time. First, missing 2MWT DCNN-based outcomes were first imputed using piecewise linear interpolation (PLI), by considering $\hat{y}$ as a time-series to impute missing test severity observations on a given date. Note: imputed 2MWTs were only included for calculation of average trend estimation for individual participants and not for model evaluation. Next, a simple trend estimation was applied to the time sequence of severity estimates ($\hat{y}$) across days ($d$) using a $d-$ centred linear moving average filter (MAF). A 7-day window was implemented in order to capture the trends in $\hat{y}_d$ over the study duration.
Key Findings
1. Remote smartphone sensor-outcomes reflect clinician-determined MS severity
In this work, it was shown how a deep network classification model could (naïvely) estimate the level of participant disability from ordinal classification categories. Severity outcome estimates stratified across HC and PwMS groups and were strongly correlated to disease status ($r$: 0.75; $\rho$: 0.71, p$<$0.001), as measured by the EDSS—considered the ground-truth assessment in PwMS
The relationship between the continuous disease severity outcome estimate, EDSS and subject group. Figure depicts the scatter plot demonstrating the positive correlation ($r$: 0.75; $\rho$: 0.71; $p<$0.001) between the average severity outcome and average EDSS score per subject. A DCNN model was constructed based on the average class predictions (HC, PwMSmild, PwMSmod) per subject over all 2MWTs, creating an estimated continuous prediction probability distribution, ranging from healthy to moderate MS. Each point therefore represents the average estimated severity outcome (probability) for that subject. A black line represents the line of best fit between severity and EDSS ($r^2$: 0.56, $p<$0.001).
For instance, no misclassifcation of HC as PwMSmod was observed, or vice-versa, indicating that severity estimates were reflective of true disease status. More interestingly, those subjects at classification boundaries displayed severities representative of their clinical assessments. For instance, those with EDSS just above 3.5 (i.e. PwMSmod) were misclassified more as PwMSmild compared to those with EDSS much greater than 3.5, implying that a reflective estimate of disease severity could be captured by transforming a DCNN model into a simple probabilistic outcome per subject.
2. Smartphones can longitudinally monitor MS ambulatory severity over a 24-week study
The longitudinal patterns of healthy controls versus participants with varying manifestations of MS severity could be characterised by examining severity outcomes over the duration of the FL study for individual subjects. For instance, the figure below depicts examples of stable trends for a correctly classified HC and PwMSmod subject respectively. While both participants had some incorrect predictions, the mean severity prediction over all repeated tests reflected the participant’s true class grouping.
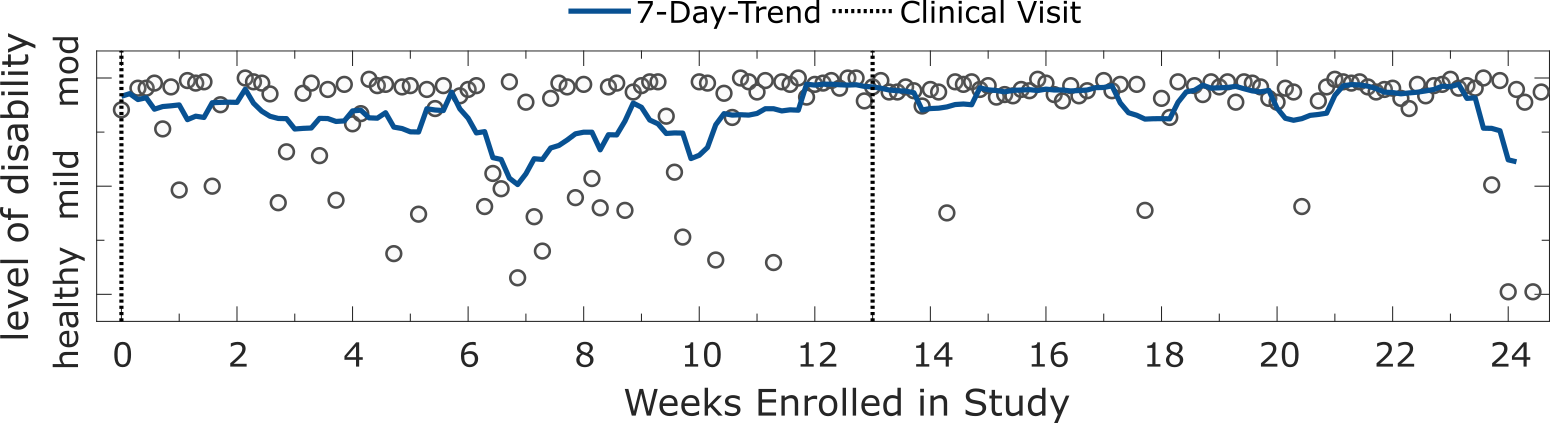
Panel plot illustrating the longitudinal severity estimate outcome for correctly classified a HC and a PwMSmod subject. Depicted are the estimated level of disability for an example a HC subject and PwMSmod subject during the study. Each circle represents the severity outcome estimate for a 2MWT performed on a given date. Shaded blue lines depict the and 7-day trend, represented by the d-point centred moving average across days (d). Dashed black lines represent site-visits where the participant was assessed clinically.
3. Remote smartphone sensor-outcomes can remotely capture MS relapse events
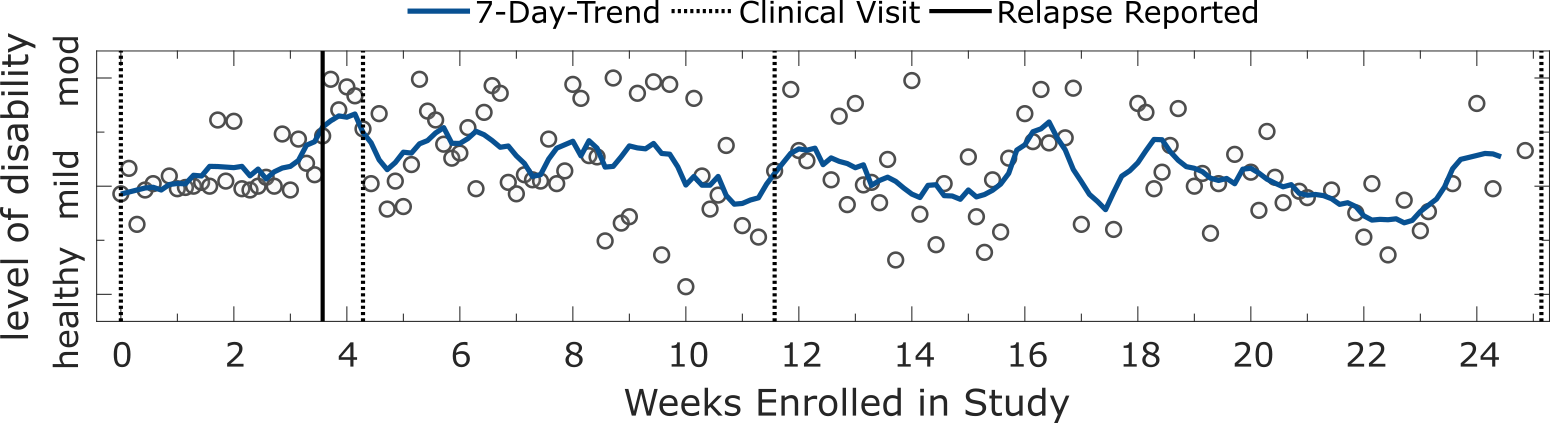
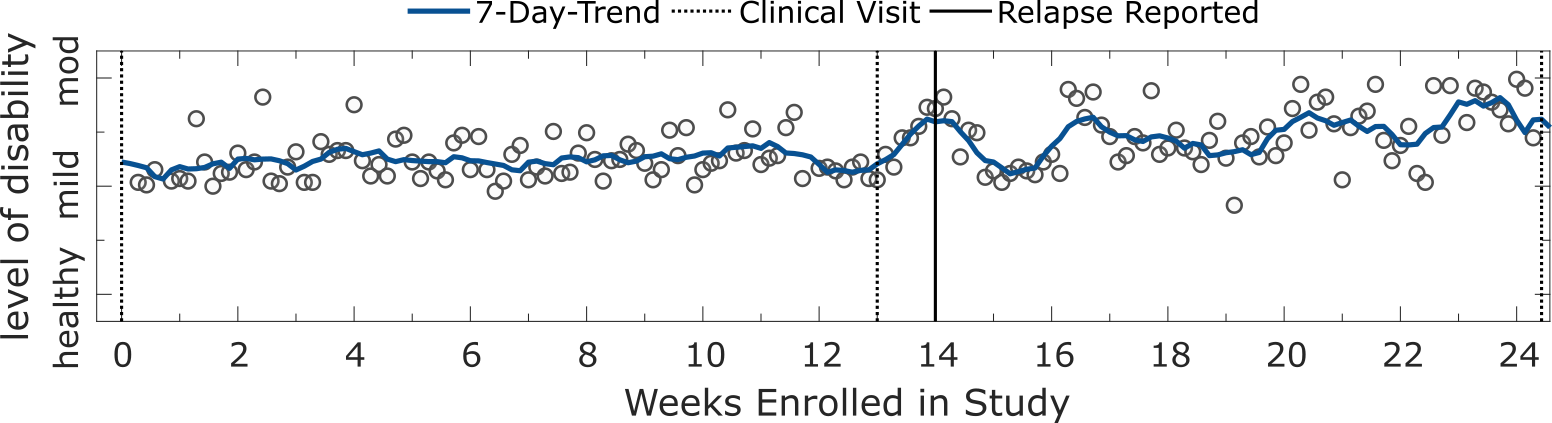
Evaluating subject’s performance longitudinally suggested that severity estimates may be sensitive to capture MS-symptom worsening, particulary relapses. During the FL study, four participants experienced relapses which they self-reported using the application on their smartphones. Longitudinal analysis of the trajectories of daily severity estimates from these subjects revealed useful insights into the manifestation of relapses expressed in remote inertial sensor data. For instance, two subjects displayed an increased severity outcome up to and around the data of reporting a relapse (see figures below), suggesting that sensor-based ambulatory outcomes could potentially be sensitive enough to remotely capture relapse events.
4. Missing data might be indicative of changes in disability status
We need to consider that missing data might also contain useful information relating to how a patient is feeling or their MS disability status. For example, the study participant below reported (non-relapse) adverse clinical events occurring on non-specified dates between weeks 8 and 12. Around these dates the particiapnt’s adhereance drops and they stop contributing daily 2MWTs. Obviously, this is an anecdotal example, but it poses the question: “did the adverse event affect this participant’s adherence or ability to perform the test ?”
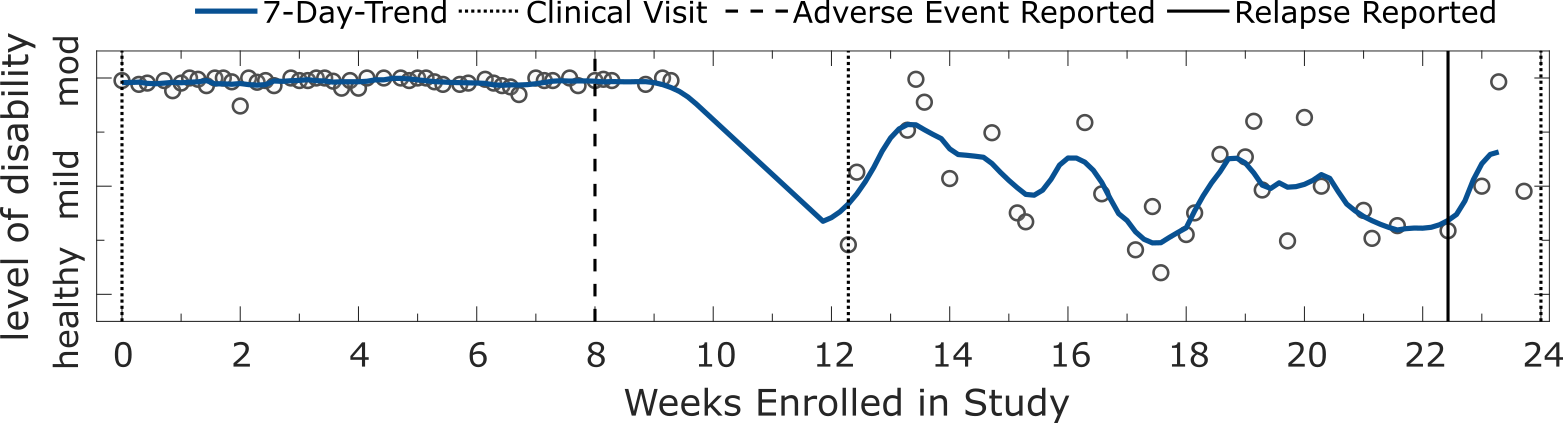
Panel plot illustrating the longitudinal severity estimate outcomes for a PwMS participants with missing data. Each circle represents the severity outcome estimate for a 2MWT performed on a given date. Shaded blue lines depict the and 7-day trend, represented by the $d$-point centred moving average across days ($d$). Dashed black lines represent site-visits where the participant was assessed clinically. Dates of self-reported relapse onset are represented in black. This participant also reported (non-relapse) adverse clinical events occurring on non-specified dates between weeks 8 and 12.
Indeed, missing data might be a marker of changes in disability status itself (i.e., that the data is not missing-at-random (MAR)). However, it is difficult to monitor patients if they’re not contributing data over a long periods—adherence will often be a problem when prescribing 2 minutes of walking a day, daily, for 24 weeks. Therefore, we must consider patient burden when developing our digital biomarker assessments and solutions. In my opinion, I think we need to consider how we can incorporate as much information as possible from passive approaches, collecting sensor data during daily life. For example, a smartwatch could collect sensor-data characterising physical activity and ambulation unobtrusively from patients. Swapping out some prescribed “active” tests, or reducing the frequency of assessments by supplementing with passive data could help build more robust longitudinal models and help circumvent some of the problems associated with missing assessment data.
Limitations
Despite the potential of smartphone-based outcomes to remotely monitor individual participant’s ambulatory function longitudinally, there are several limitations of this study which must be considered.
- Severity outcomes explored in this work were naïve estimates: although outcomes captured a trend of increased impairment with higher severity (as modelled by EDSS), they should not be considered an exact measure of MS, nor a surrogate clinical outcome to permit any clinical diagnosis, or replace in-clinic assessments.
- Estimates were not always correct!: there were many subject misclassifications. In this work we only showed correct and stable estimate examples, however, it must be noted that some participants, both healthy or with MS, followed irregular trends or whose estimated level of disability were consistently incorrect.
-
Predicted outcomes were based solely on ambulation performance: The 2MWT is an assessment originally only intended to investigate ambulatory function and fatigue in PwMS through the measurement of distance travelled
. Many participants in the FL PoC study may not have had ambulatory-related dysfunction, or whose milder level of disease did not impair their gait, compared to the healthy control cohort. - Constructing more robust severity outcomes should also aim to incorporate the data captured from other functional domains, such as dexterity and cognition assesments.
- The performance of 2MWT can be highly influenced by the testing environment: the FL 2MWT was a remotely executed out-of-clinic assessment. We cannot determine how factors such as the length of the hallways, or the number and frequency of subject turns can affect individual’s performance and the subsequent relaibility of our model.
-
The time-series nature of daily repeated 2MWT measurements was not fully utilised: Each repeated test was treated as independent, and as such, trajectories did not incorporate any temporal information across a population or within a subject; for example, whether the previous day’s $d-1$ test could affect the outcome at $d$ or $d+1$).
- It would be assumed that this is critically missing temporal information which could help build more reliable and accurate longitudinal models.
- For instance, the repeated FL assessments, and therefore sensor outcomes that were extracted, could be analysed with models that exploit this aggregation of temporal information directly
.
Impact
We believe that the work presented in this study to be of important value, emphasising the potential of remote sensor outcomes to augment current in-clinic acquired patient information. The long-term remote monitoring of PwMS function could open up the space for true personalisation: the clustering of disease trajectories or similar patients, estimating the likelihood of disease progression, quantifying response to different treatments as a population or an individual, as well catching the mutable patterns of MS disease that are only visible out-of-clinic and as a function of time. We believe that our work helps informs future digital health technology-based study design, to better remotely characterise the impact of MS, ultimately to expand the use of DHT to develop more sensitive, and patient-centric, endpoints in clinical trials and real-world studies.
Reference
If you use or like our work, please consider citing us:
@article{creagh2022longitudinal,
  author={Creagh, Andrew P. and Dondelinger, Frank and Lipsmeier, Florian and Lindemann, Michael and De Vos, Maarten},
  journal={IEEE Open Journal of Engineering in Medicine and Biology},
  title={Longitudinal Trend Monitoring of Multiple Sclerosis Ambulation Using Smartphones},
  year={2022},
  volume={3},
  number={},
  pages={202-210},
  doi={10.1109/OJEMB.2022.3221306}
}